Examples
Scatter
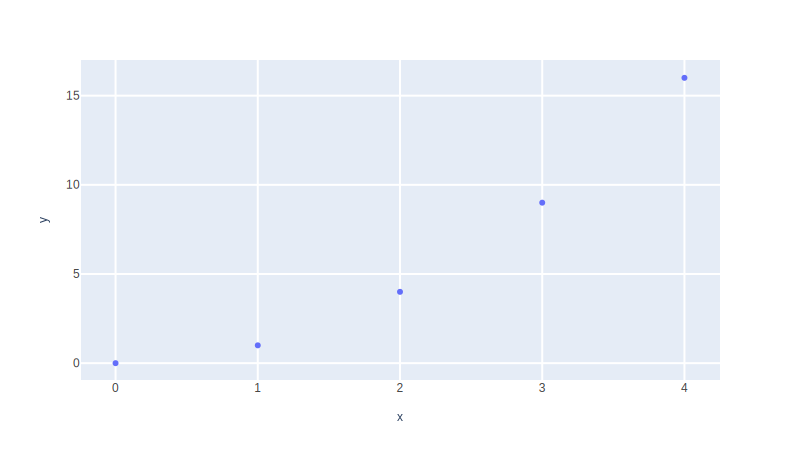
Scatter 1
fig = px.scatter(x=[0, 1, 2, 3, 4], y=[0, 1, 4, 9, 16])
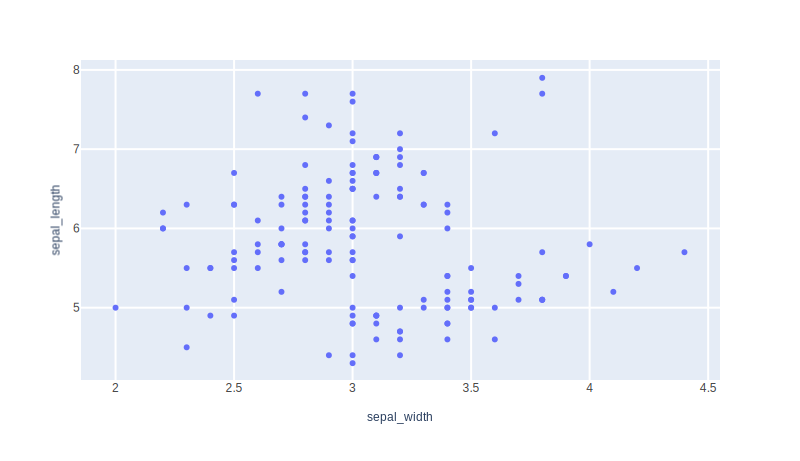
Scatter 2
        df = px.data.iris()
        fig = px.scatter(df, x="sepal_width", y="sepal_length")
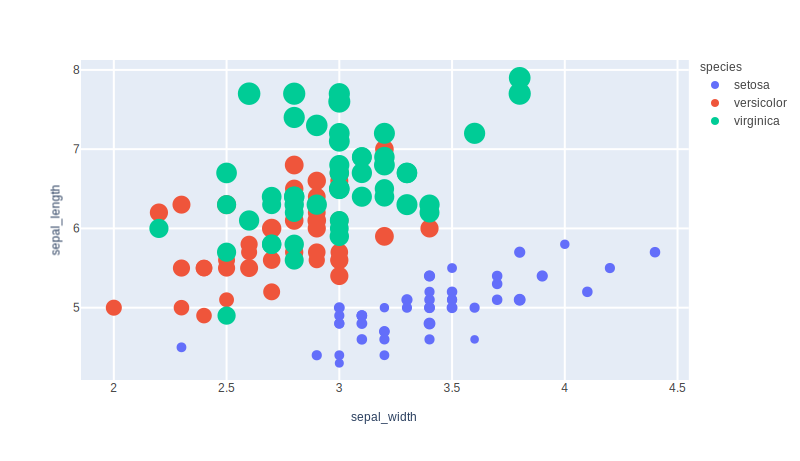
Scatter size color column
        df = px.data.iris()
        fig = px.scatter(
            df,
            x="sepal_width",
            y="sepal_length",
            color="species",
            size="petal_length",
            hover_data=["petal_width"],
        )
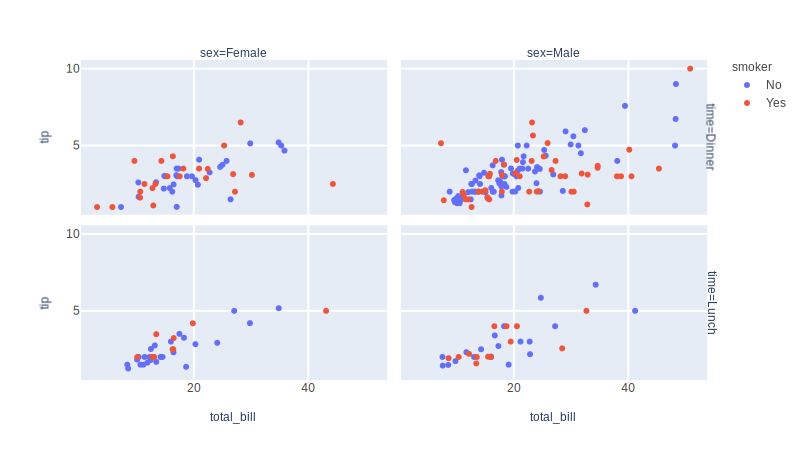
Scatter facetting
        df = px.data.tips()
        fig = px.scatter(
            df,
            x="total_bill",
            y="tip",
            color="smoker",
            facet_col="sex",
            facet_row="time",
        )
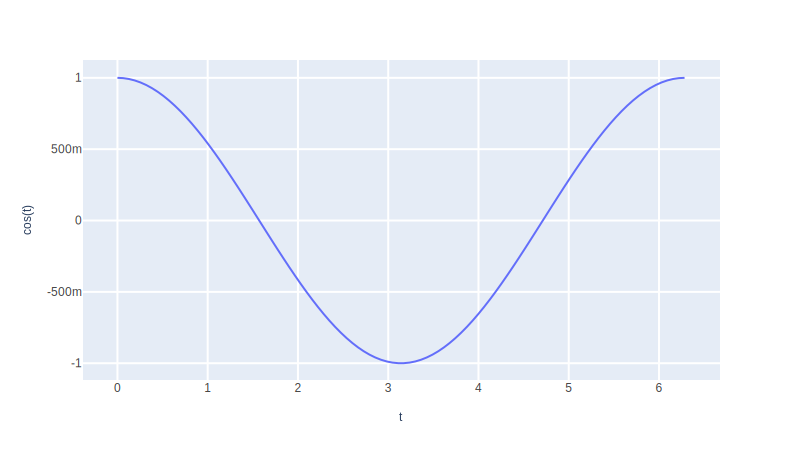
Line 1
        t = np.linspace(0, 2 * np.pi, 100)
        fig = px.line(x=t, y=np.cos(t), labels={"x": "t", "y": "cos(t)"})
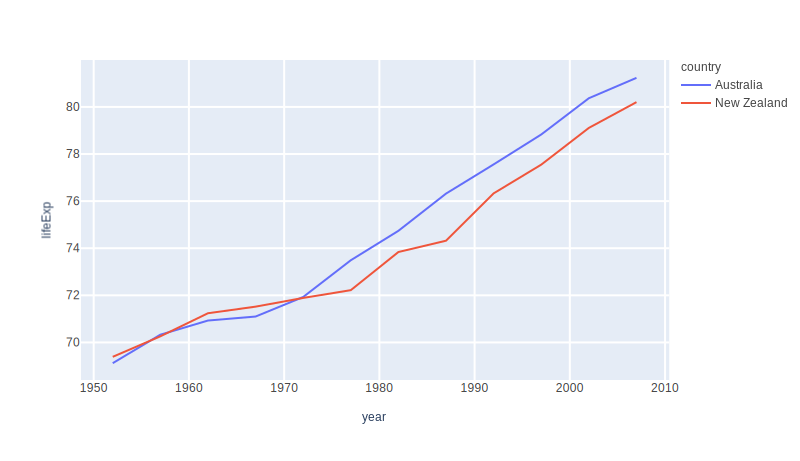
Line 2
        df = px.data.gapminder().query("continent == 'Oceania'")
        fig = px.line(df, x="year", y="lifeExp", color="country")
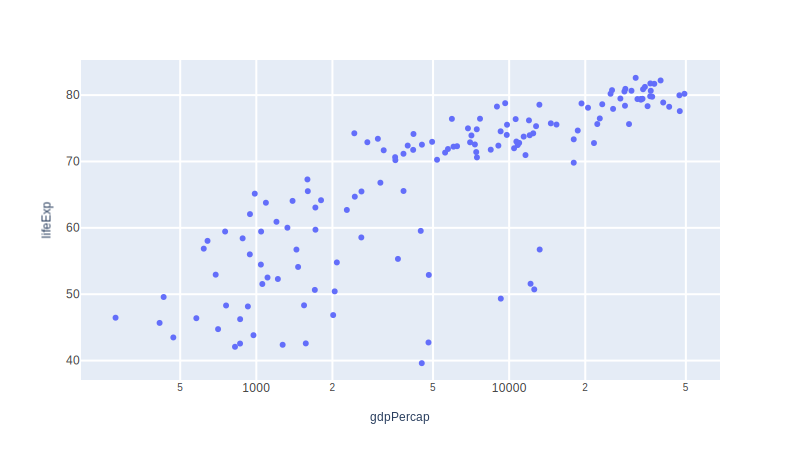
log
Log 1
        df = px.data.gapminder().query("year == 2007")
        fig = px.scatter(
            df, x="gdpPercap", y="lifeExp", hover_name="country", log_x=True
        )
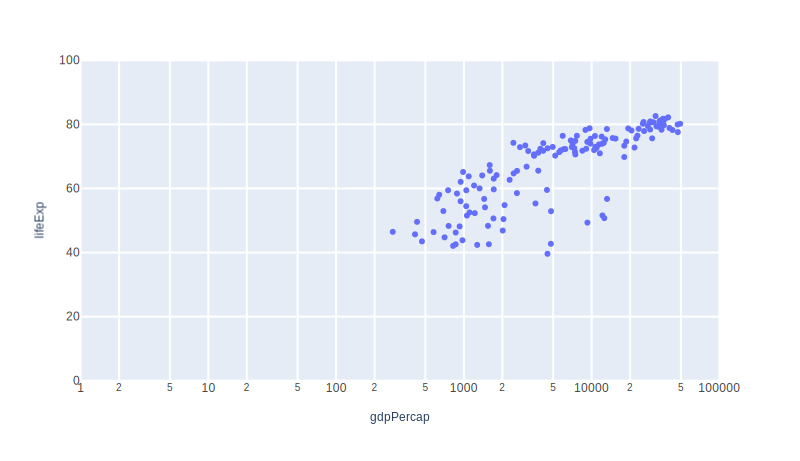
Log 2
        df = px.data.gapminder().query("year == 2007")
        fig = px.scatter(
            df,
            x="gdpPercap",
            y="lifeExp",
            hover_name="country",
            log_x=True,
            range_x=[1, 100000],
            range_y=[0, 100],
        )
Multiple axes
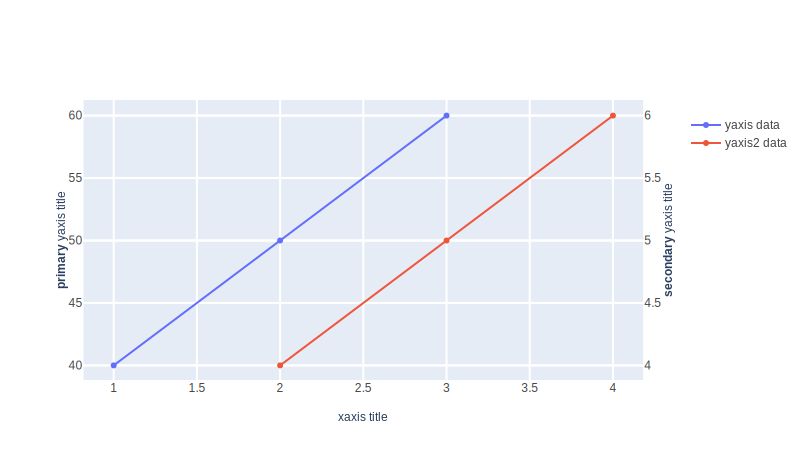
Two y axes
        # Create figure with secondary y-axis
        fig = make_subplots(specs=[[{"secondary_y": True}]])

        # Add traces
        fig.add_trace(
            go.Scatter(x=[1, 2, 3], y=[40, 50, 60], name="yaxis data"),
            secondary_y=False,
        )

        fig.add_trace(
            go.Scatter(x=[2, 3, 4], y=[4, 5, 6], name="yaxis2 data"),
            secondary_y=True,
        )

        # Add figure title
        fig.update_layout(title_text="Double Y Axis Example")

        # Set x-axis title
        fig.update_xaxes(title_text="xaxis title")

        # Set y-axes titles
        fig.update_yaxes(title_text="<b>primary</b> yaxis title", secondary_y=False)
        fig.update_yaxes(title_text="<b>secondary</b> yaxis title", secondary_y=True)
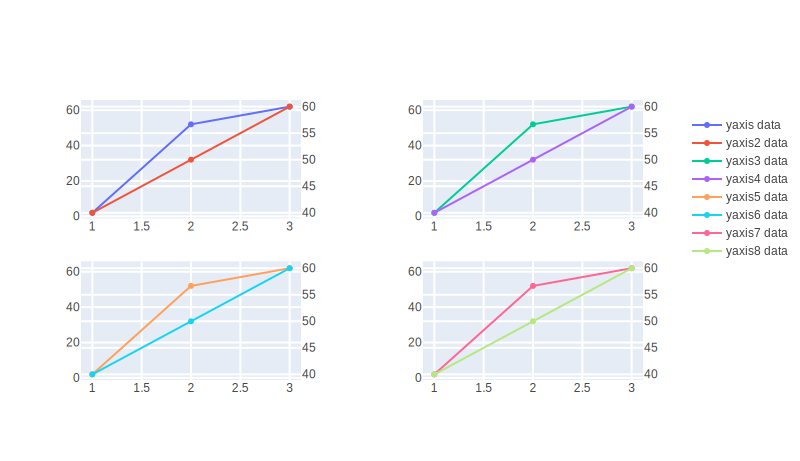
Multiple y axes subplots
        fig = make_subplots(
            rows=2,
            cols=2,
            specs=[
                [{"secondary_y": True}, {"secondary_y": True}],
                [{"secondary_y": True}, {"secondary_y": True}],
            ],
        )

        # Top left
        fig.add_trace(
            go.Scatter(x=[1, 2, 3], y=[2, 52, 62], name="yaxis data"),
            row=1,
            col=1,
            secondary_y=False,
        )

        fig.add_trace(
            go.Scatter(x=[1, 2, 3], y=[40, 50, 60], name="yaxis2 data"),
            row=1,
            col=1,
            secondary_y=True,
        )

        # Top right
        fig.add_trace(
            go.Scatter(x=[1, 2, 3], y=[2, 52, 62], name="yaxis3 data"),
            row=1,
            col=2,
            secondary_y=False,
        )

        fig.add_trace(
            go.Scatter(x=[1, 2, 3], y=[40, 50, 60], name="yaxis4 data"),
            row=1,
            col=2,
            secondary_y=True,
        )

        # Bottom left
        fig.add_trace(
            go.Scatter(x=[1, 2, 3], y=[2, 52, 62], name="yaxis5 data"),
            row=2,
            col=1,
            secondary_y=False,
        )

        fig.add_trace(
            go.Scatter(x=[1, 2, 3], y=[40, 50, 60], name="yaxis6 data"),
            row=2,
            col=1,
            secondary_y=True,
        )

        # Bottom right
        fig.add_trace(
            go.Scatter(x=[1, 2, 3], y=[2, 52, 62], name="yaxis7 data"),
            row=2,
            col=2,
            secondary_y=False,
        )

        fig.add_trace(
            go.Scatter(x=[1, 2, 3], y=[40, 50, 60], name="yaxis8 data"),
            row=2,
            col=2,
            secondary_y=True,
        )
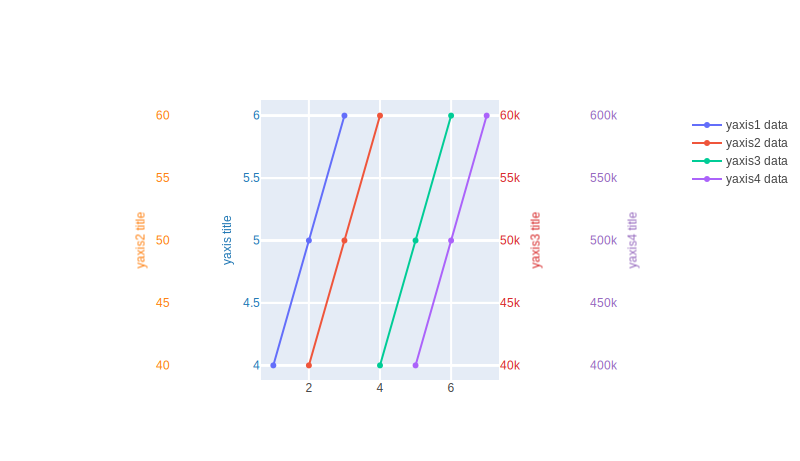
Multiple axes
        fig = go.Figure()

        fig.add_trace(go.Scatter(x=[1, 2, 3], y=[4, 5, 6], name="yaxis1 data"))

        fig.add_trace(
            go.Scatter(x=[2, 3, 4], y=[40, 50, 60], name="yaxis2 data", yaxis="y2")
        )

        fig.add_trace(
            go.Scatter(
                x=[4, 5, 6], y=[40000, 50000, 60000], name="yaxis3 data", yaxis="y3"
            )
        )

        fig.add_trace(
            go.Scatter(
                x=[5, 6, 7], y=[400000, 500000, 600000], name="yaxis4 data", yaxis="y4"
            )
        )

        # Create axis objects
        fig.update_layout(
            xaxis=dict(domain=[0.3, 0.7]),
            yaxis=dict(
                title=dict(text="yaxis title", font=dict(color="#1f77b4")),
                tickfont=dict(color="#1f77b4"),
            ),
            yaxis2=dict(
                title=dict(text="yaxis2 title", font=dict(color="#ff7f0e")),
                tickfont=dict(color="#ff7f0e"),
                anchor="free",
                overlaying="y",
                side="left",
                position=0.15,
            ),
            yaxis3=dict(
                title=dict(text="yaxis3 title", font=dict(color="#d62728")),
                tickfont=dict(color="#d62728"),
                anchor="x",
                overlaying="y",
                side="right",
            ),
            yaxis4=dict(
                title=dict(text="yaxis4 title", font=dict(color="#9467bd")),
                tickfont=dict(color="#9467bd"),
                anchor="free",
                overlaying="y",
                side="right",
                position=0.85,
            ),
        )

        # Update layout properties
        fig.update_layout(
            title_text="multiple y-axes example",
            width=800,
        )
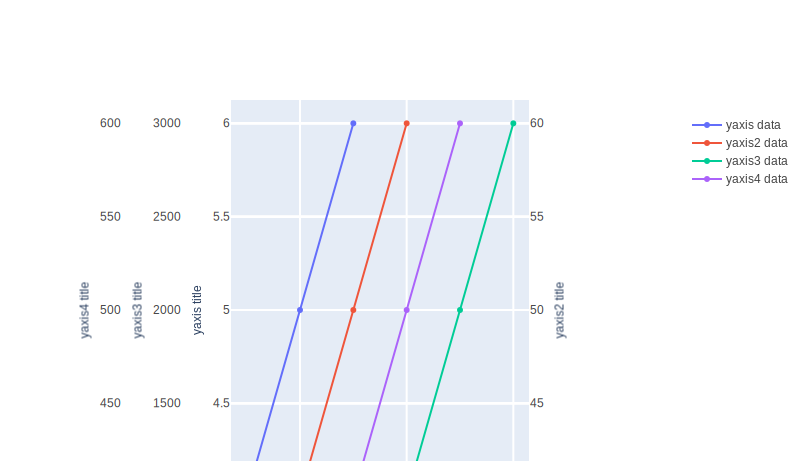
Autoshift
        fig = go.Figure()

        fig.add_trace(go.Scatter(x=[1, 2, 3], y=[4, 5, 6], name="yaxis data"))

        fig.add_trace(
            go.Scatter(x=[2, 3, 4], y=[40, 50, 60], name="yaxis2 data", yaxis="y2")
        )

        fig.add_trace(
            go.Scatter(
                x=[4, 5, 6], y=[1000, 2000, 3000], name="yaxis3 data", yaxis="y3"
            )
        )

        fig.add_trace(
            go.Scatter(x=[3, 4, 5], y=[400, 500, 600], name="yaxis4 data", yaxis="y4")
        )

        fig.update_layout(
            xaxis=dict(domain=[0.25, 0.75]),
            yaxis=dict(
                title="yaxis title",
            ),
            yaxis2=dict(
                title="yaxis2 title",
                overlaying="y",
                side="right",
            ),
            yaxis3=dict(
                title="yaxis3 title", anchor="free", overlaying="y", autoshift=True
            ),
            yaxis4=dict(
                title="yaxis4 title",
                anchor="free",
                overlaying="y",
                autoshift=True,
            ),
        )

        fig.update_layout(
            title_text="Shifting y-axes with autoshift",
        )
Shift by pixels
        fig = go.Figure()

        fig.add_trace(go.Scatter(x=[1, 2, 3], y=[4, 5, 6], name="yaxis data"))

        fig.add_trace(
            go.Scatter(x=[2, 3, 4], y=[40, 50, 60], name="yaxis2 data", yaxis="y2")
        )

        fig.add_trace(
            go.Scatter(
                x=[4, 5, 6], y=[1000, 2000, 3000], name="yaxis3 data", yaxis="y3"
            )
        )

        fig.add_trace(
            go.Scatter(x=[3, 4, 5], y=[400, 500, 600], name="yaxis4 data", yaxis="y4")
        )

        fig.update_layout(
            xaxis=dict(domain=[0.25, 0.75]),
            yaxis=dict(
                title="yaxis title",
            ),
            yaxis2=dict(
                title="yaxis2 title",
                overlaying="y",
                side="right",
            ),
            yaxis3=dict(
                title="yaxis3 title", anchor="free", overlaying="y", autoshift=True
            ),
            yaxis4=dict(
                title="yaxis4 title",
                anchor="free",
                overlaying="y",
                autoshift=True,
                shift=-100,
            ),
        )

        fig.update_layout(
            title_text="Shifting y-axes by a specific number of pixels",
        )
    else:
        return